This guide aims to provide a quick reference to assist all users of the Tusla Data Hub to:
We hope you find Tusla Data Hub service useful.
NOTE: The site is updated regularly and functionality may change.
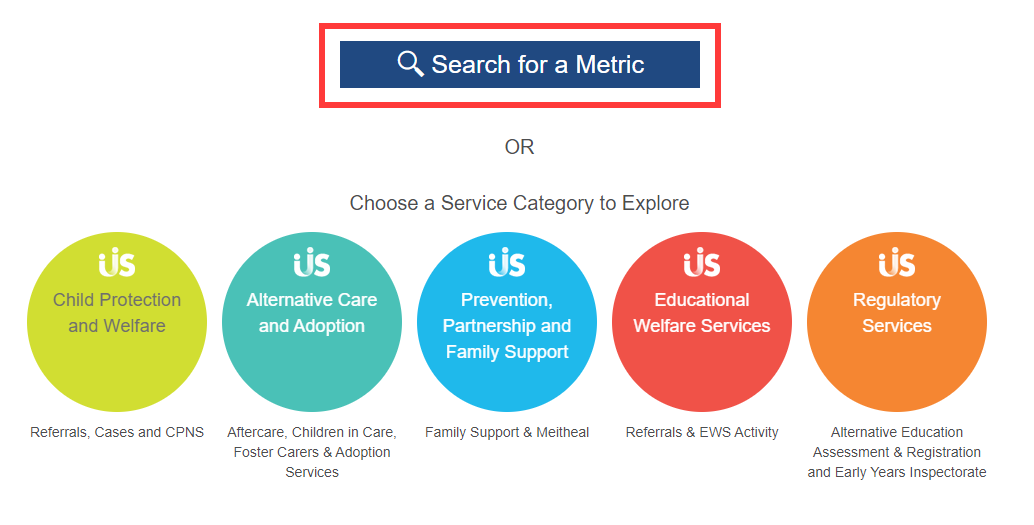
Click on ‘Search for a Metric’
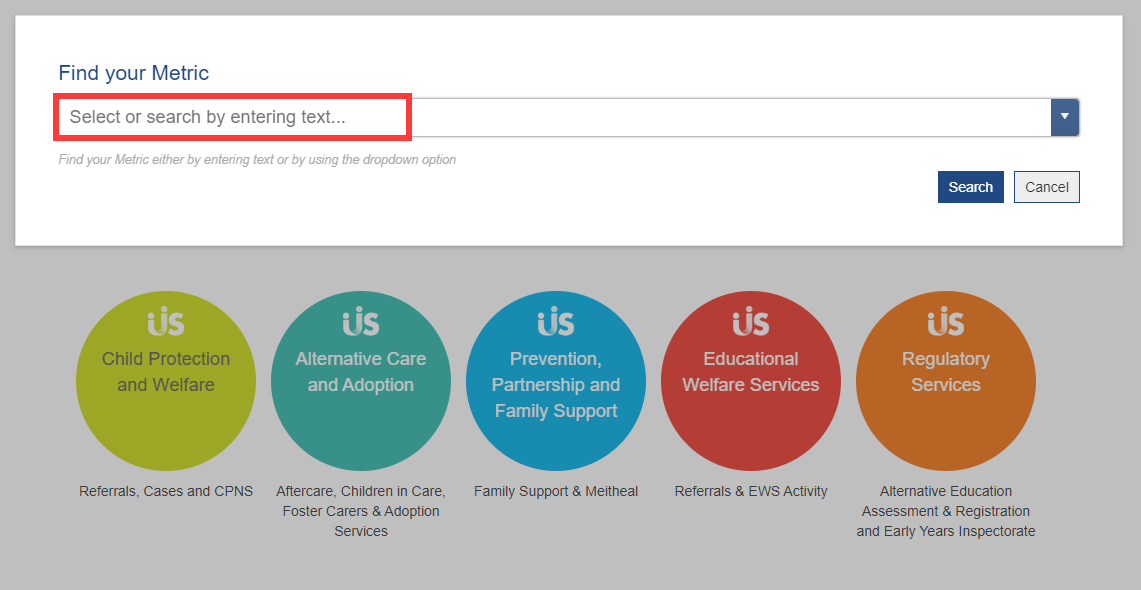
Start typing, e.g. “general foster carers”. If there is a metric available, it will appear in the drop-down list and you can then select it.
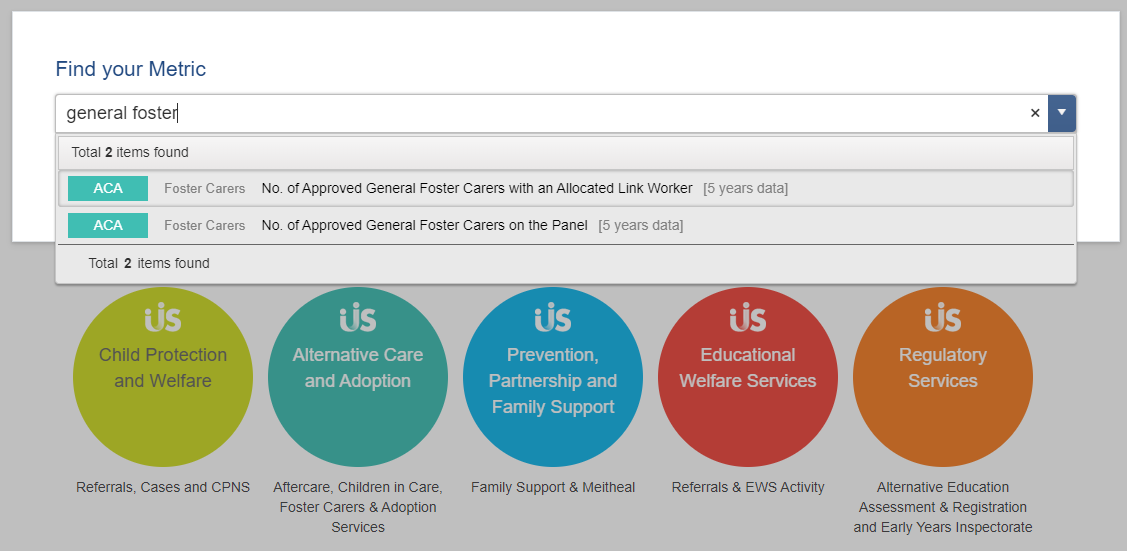
Once the metric you wish to view is selected, click on the ‘Search’ button on the right-hand side:

You can search for a metric by using the drop-down list. To do so select ‘Search for a Metric’ and choose the metric which is of interest to you
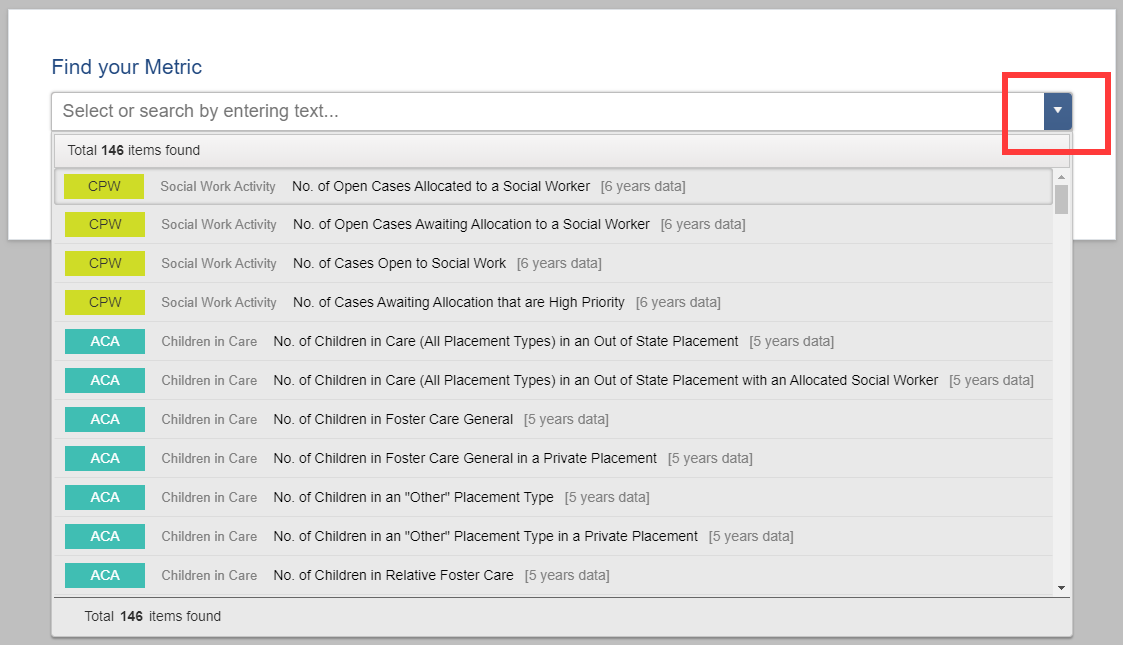
Alternatively you can search by one of the following five service categories that are listed on the home page:
To view data, simply click on the category that is of interest to you:
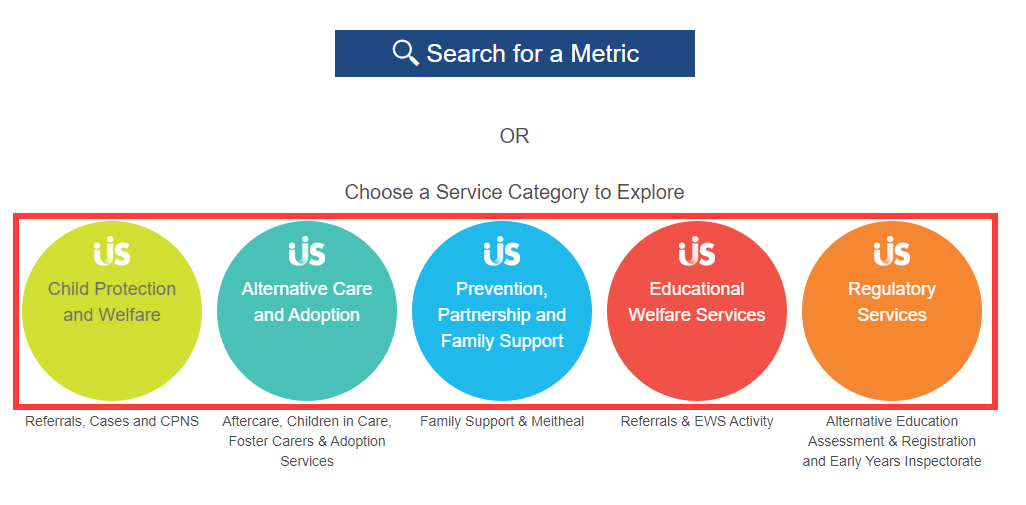
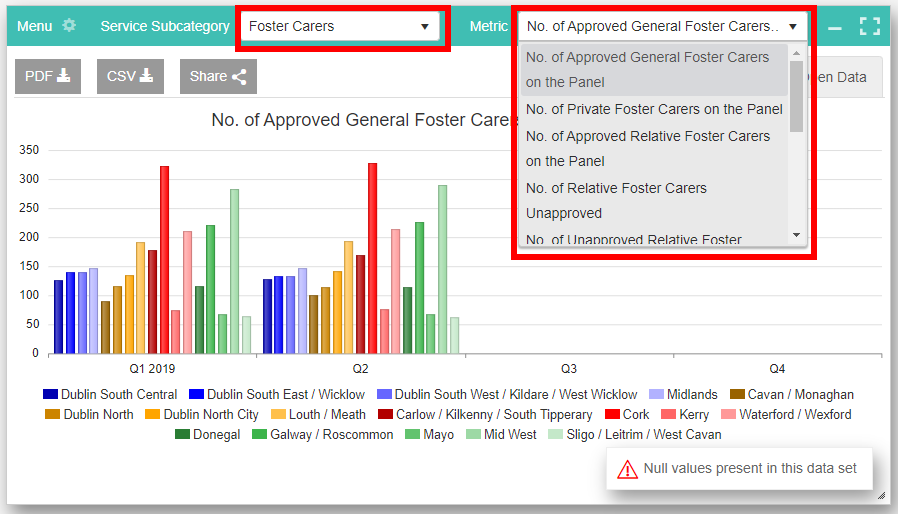
Then select a metric from the drop-down list under the relevant sub-category.
For example, select Alternative Care & Adoption > Foster Carers > No. of Approved General Foster Carers on the Panel:
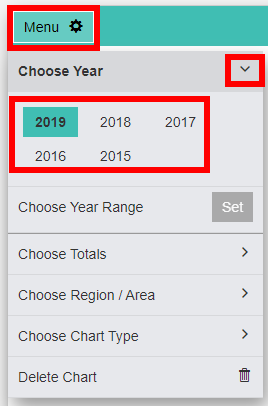
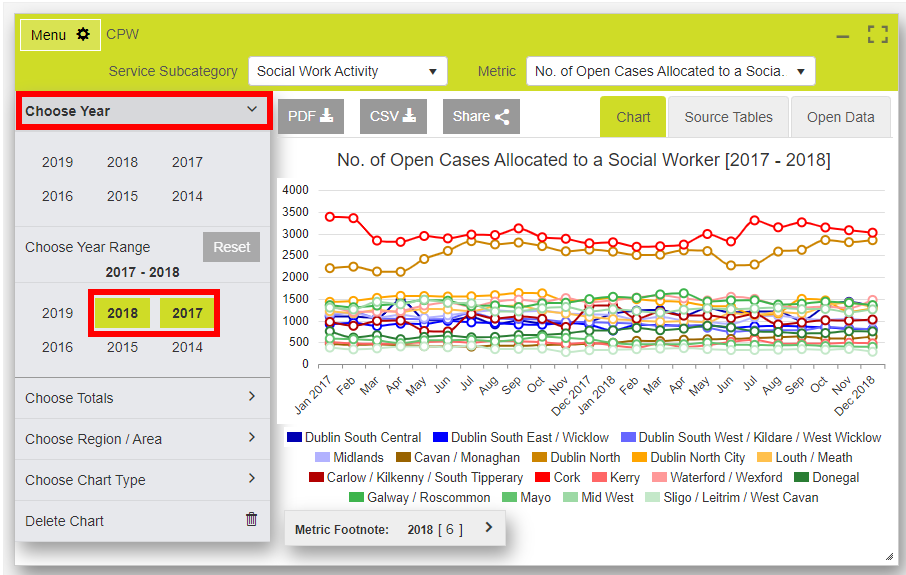
To choose a year for a metric, select the Menu (top left) and then ‘Choose Year’:
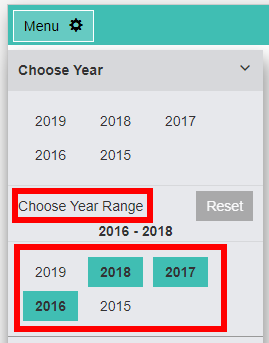
To choose a year range for a metric, select ‘Choose Year Range’ and then select the range of years you wish to view.
For example, select 2015 to 2017 to show all results over these 3 years:
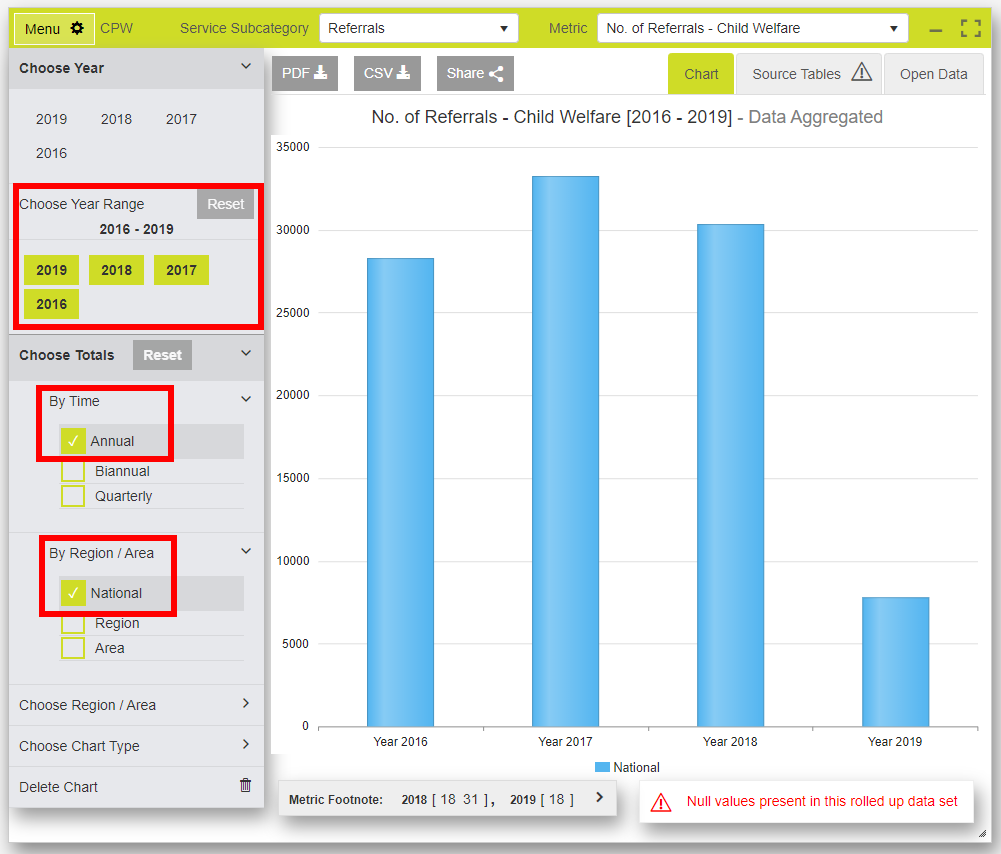
It is possible to aggregate or “roll-up” the data by time and/or area depending on the metric.
By Time: from Monthly to Quarterly to Biannual to Annual
By Area: from Tusla Area to Tusla Region to National
For example, here is No. of Referrals – Child Welfare for 2016 to 2019 aggregated from Quarterly to Annual and from Area to National:
NOTE: Some metrics are only captured at the Regional or National level
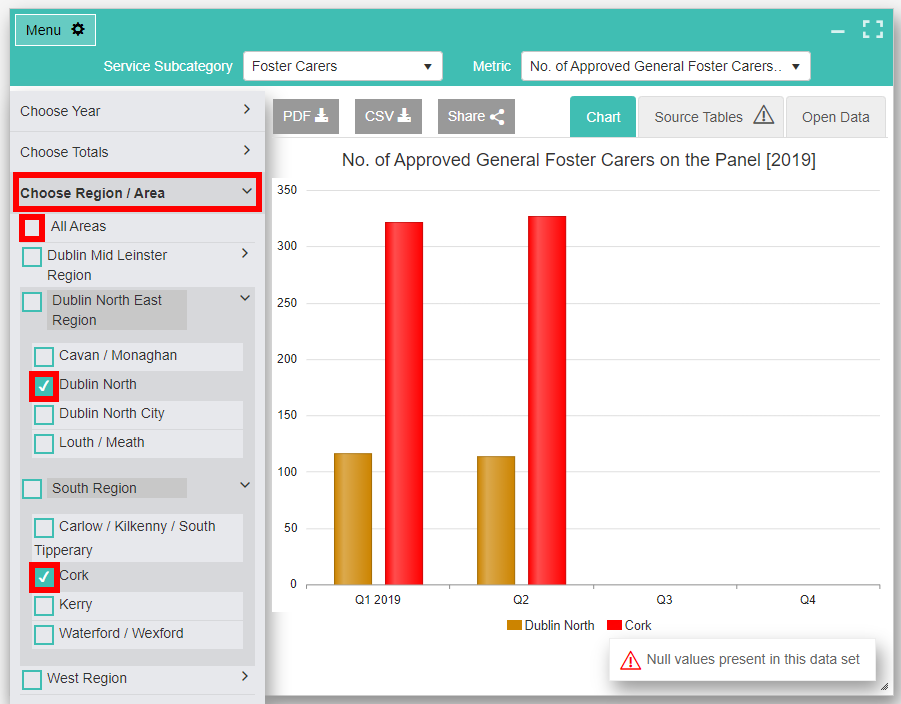
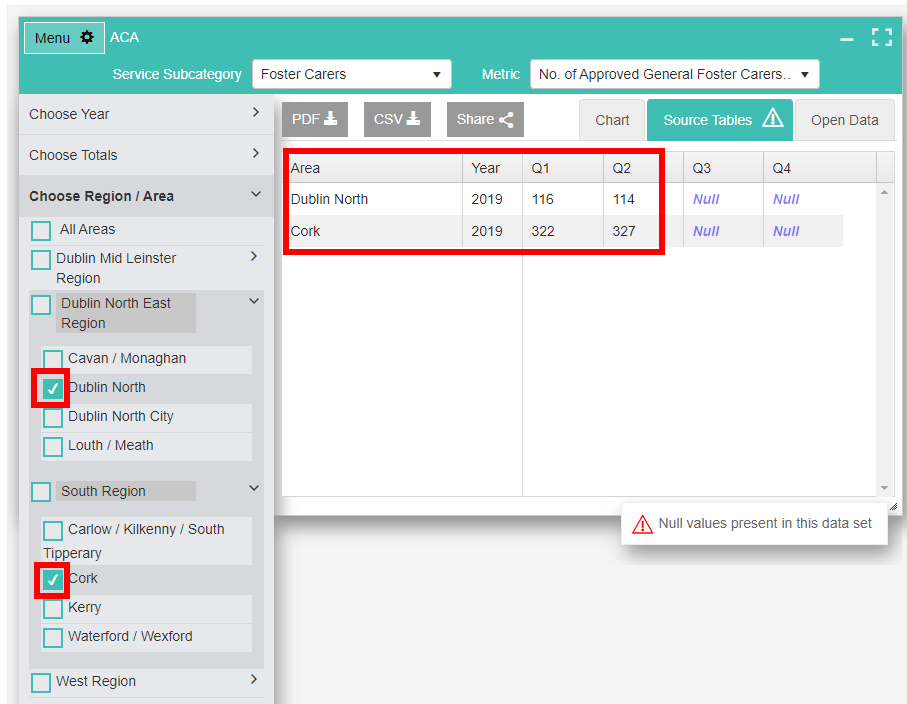
Select the ‘Source Tables’ tab/button on the right-hand side to view the data for the current view of the chart.
Example 1: As above, if the chart is filtered to show only Dublin North and Cork, then the Source Tables will only show those areas for that year:
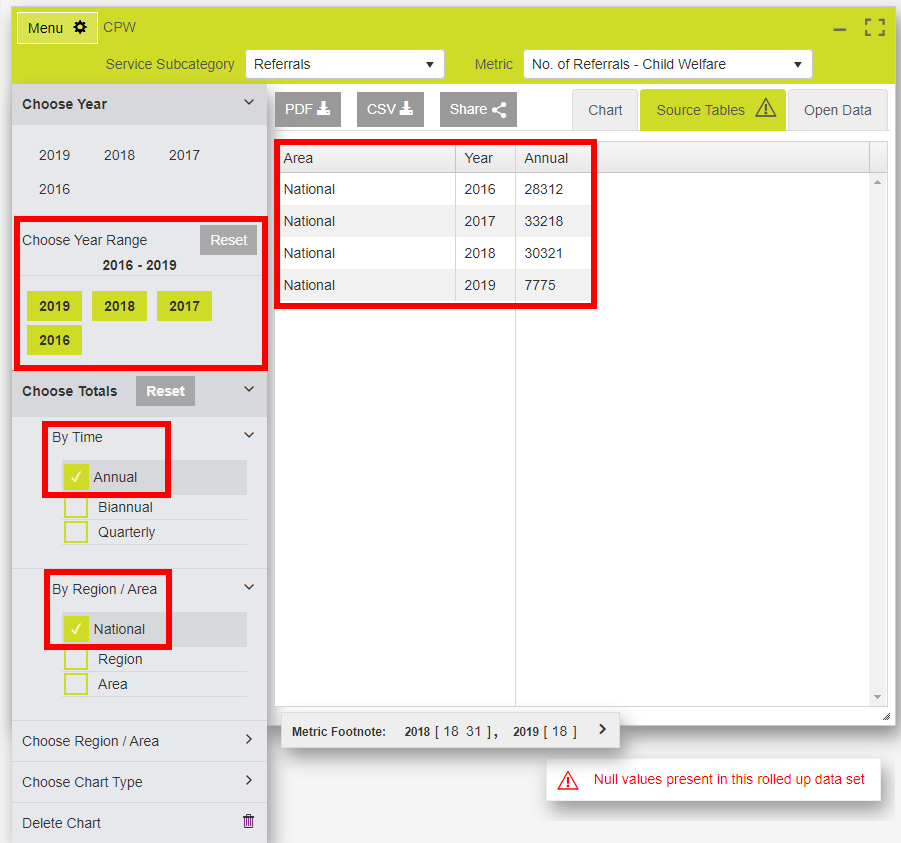
Example 2: If the chart is aggregated to show four years of national annual data then that is reflected both in the chart and the source tables:
Step 1 – Select by Category
Step 2 – Select ‘Add a Chart’ to the right-hand side of the chart
Step 3 – Change Chart Layout (above the top chart) to (2 x 2) or (3 x 3)

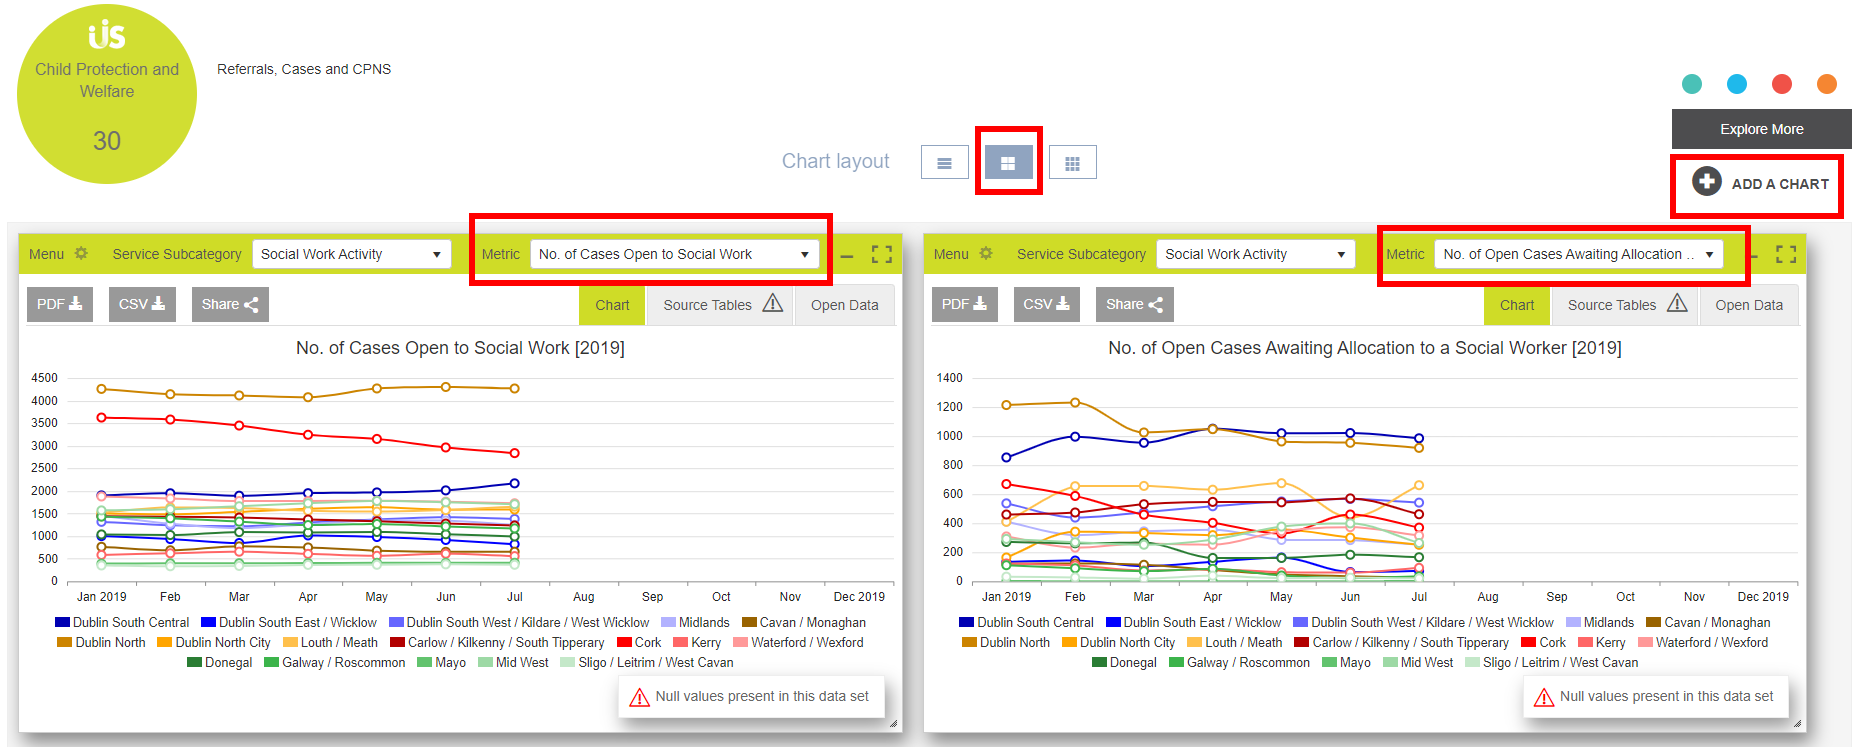
Step 1 – Select ‘Explore More’ (right-hand side above ‘Add a Chart’) to take you back to the home page
Step 2 – Search for a Metric (either choose for the drop-down list or type to search)
Step 3 – Once metric is chosen, you may ‘Search for another Metric’ from any Service Category
Step 4 – Change Chart Layout – to view side by side
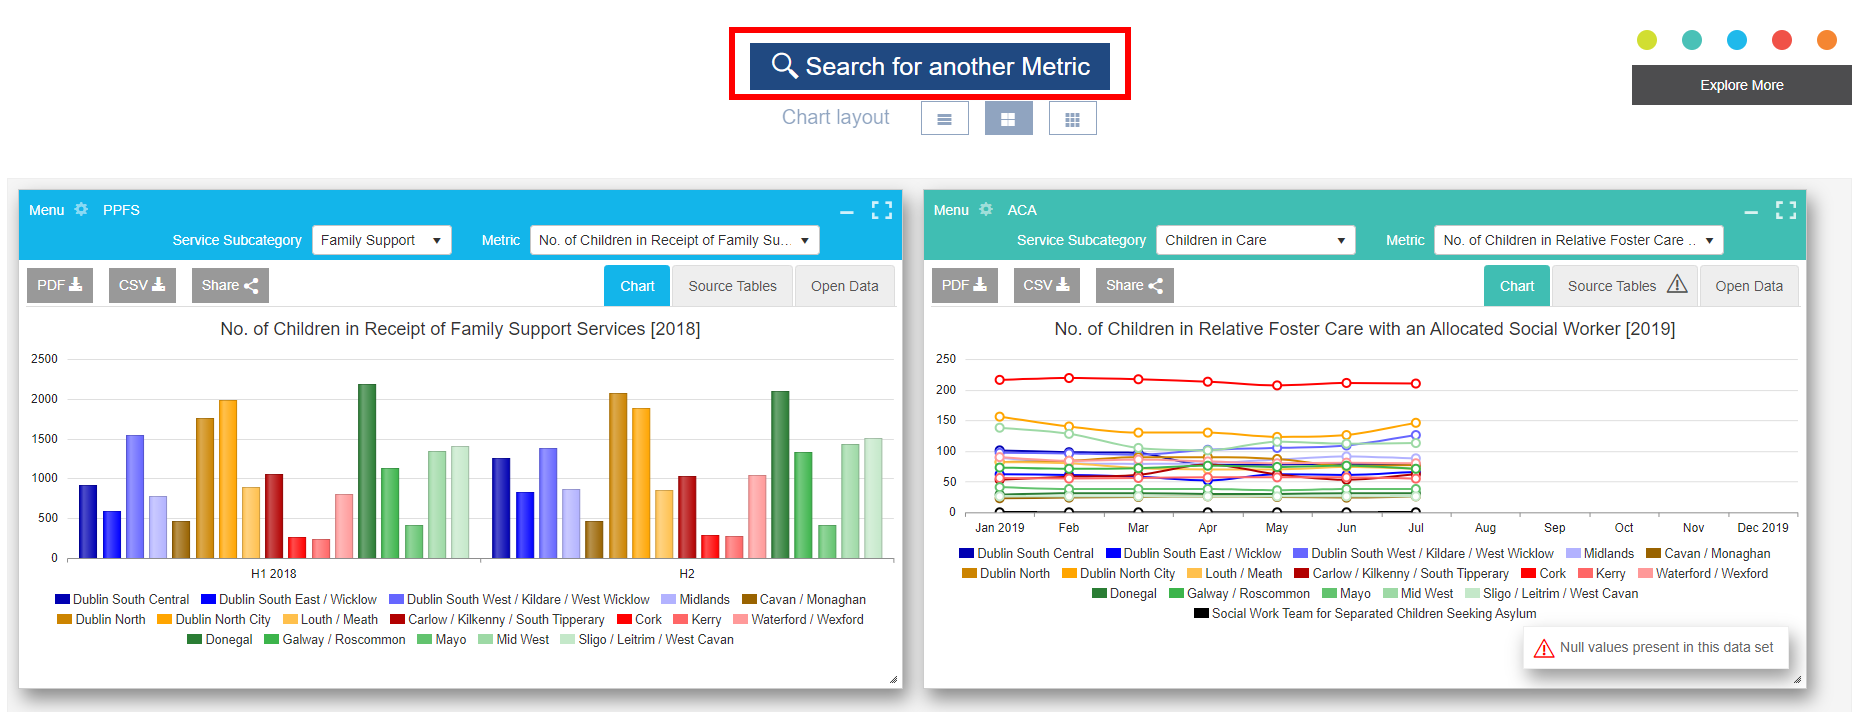
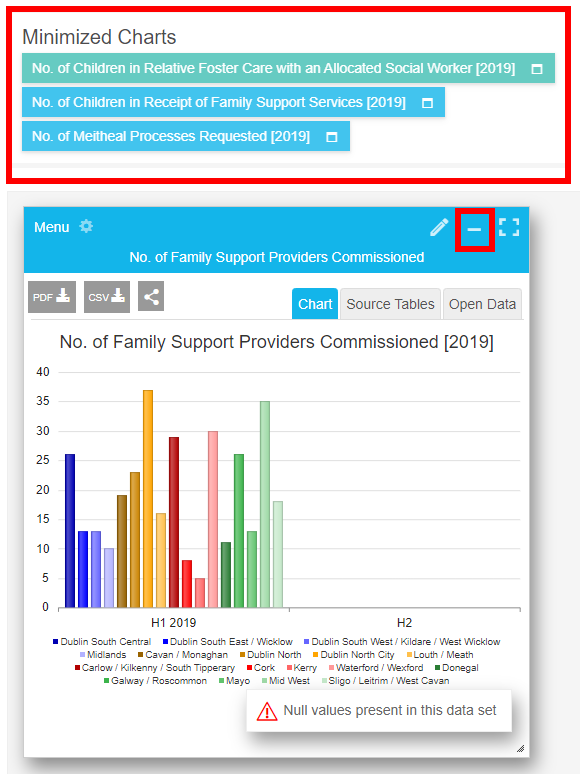
Minimise charts while you ‘Explore More’ charts. They will remain there for the duration of your online session or until you select ‘Home’ or refresh your page.
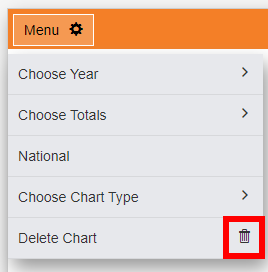
Open the Menu for any chart and click on the bin beside ‘Delete Chart’:
To download a metric as a PDF click on the PDF button and then confirm you want to save.

To download a metric as a CSV click on the CSV button and then confirm you want to save the file. These files can be opened and analysed further using, for example, Microsoft Excel.

You can share a link to a chart of a metric on the Tusla Data Hub by selecting the ‘Share’ button and then either click on the hyperlink to immediately open the metric in your browser or copy the link to the clipboard using the button as follows:

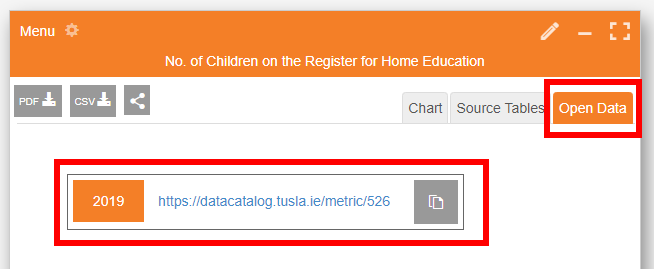
If you wish to interrogate the data further, there is a link to our Tusla Open Data Catalog for every metric by year.
Select the ‘Open Data’ tab/button and either click the link or copy the link to your clipboard:
For further information on our Tusla Open Data Catalogue, see here.
“Show me the total number of open cases allocated in the Dublin Mid Leinster (DML) and Dublin North East (DNE) regions from 2017 to 2018” (Tip: use the drop-down list from the home page).
Step 1- ‘Search for a Metric’ on the homepage.
Step 2 – Type “open cases” and select ‘No. of Open Cases Allocated to a Social Worker’. Click ‘Search’.

Step 3 – Select the ‘Menu’ option and choose the following year range: 2017-2018.
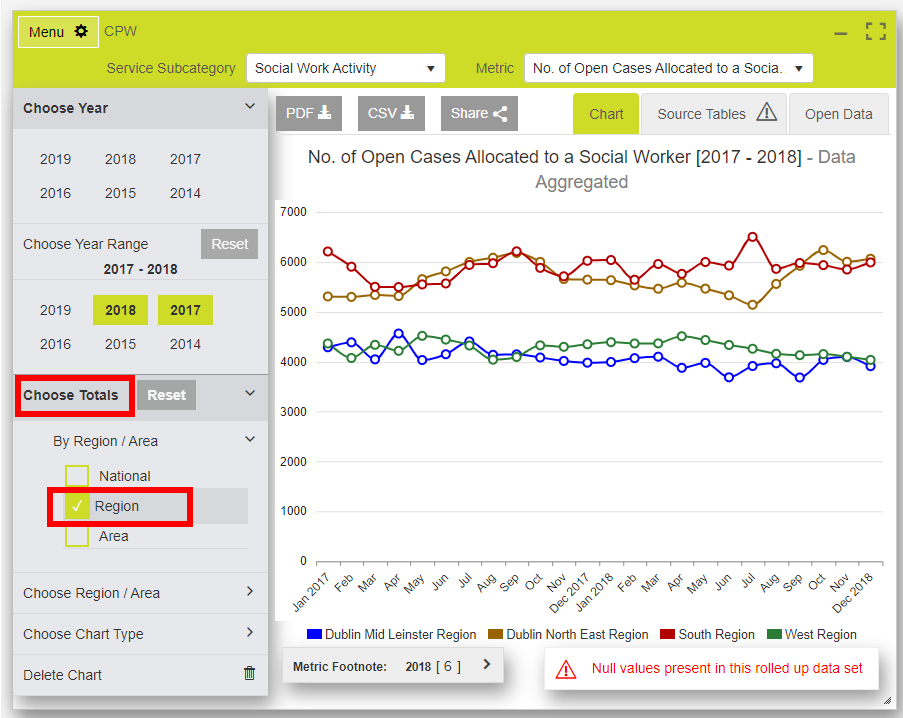
Step 4 – Choose Totals – select ‘Region’ to roll-up the totals from each Area to their Regions
Step 5 – Select the DML and DNE regions in the ‘Choose Region / Area’ section:
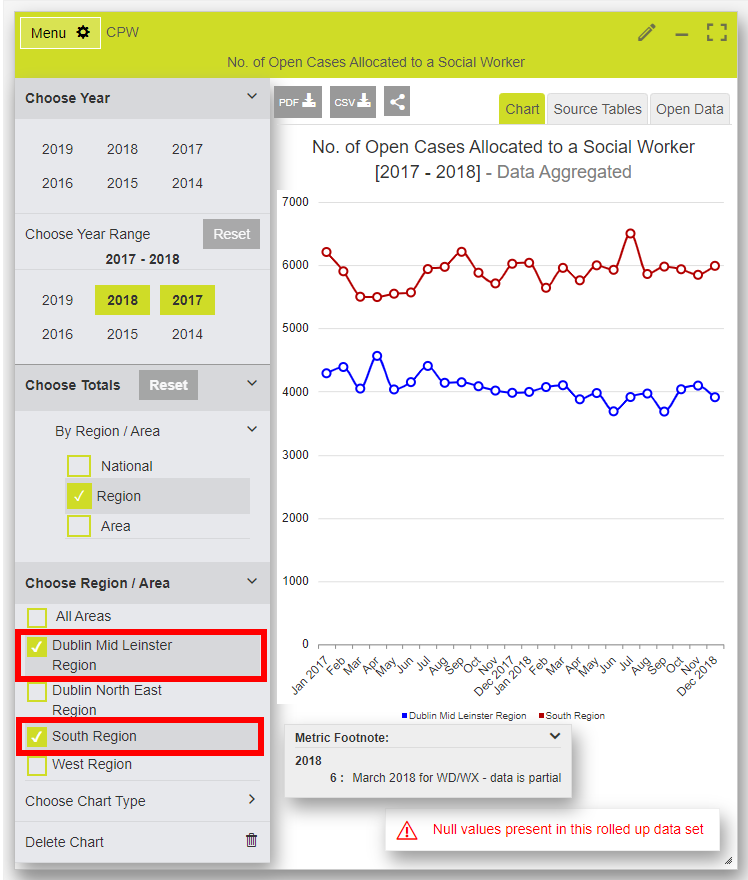
Your metric is now ready! You can download it now as a PDF, CSV or share as a link.